In the world of data-driven decision-making, predictive analytics stands at the forefront, offering valuable insights for the future based on past data. This article delves into various time series predictive modeling techniques, from basic data aggregation and analysis to more complex methods like ARIMA and ARDL models. These methodologies are crucial in deciphering patterns and trends from historical data, making them indispensable across various sectors including finance, healthcare, and environmental studies.
We will also explore tools like Facebook Prophet, which simplify complex forecasting tasks for a wide range of users. This journey through predictive analytics showcases the significance of these techniques in making informed decisions and strategies in a rapidly evolving landscape.
In addition, our article includes an insightful case study to demonstrate the real-world application of these advanced predictive models. This case study centers on the analysis of police department call data within various city subzones, employing a rich dataset that tracks key metrics over time. We specifically utilized ARIMA, ARDL, and ARMA models to not only decipher historical patterns but also to project future trends.
The Fundamentals of Data Aggregation and Analysis
The cornerstone of effective data science lies in the ability to aggregate and analyze data. Data aggregation is a crucial initial step that involves transforming scattered, unwieldy data into a streamlined and structured form amenable to analysis [Patibandla et al., 2021]. This technique is vitally important for managing and deciphering large and complex datasets and serves as the groundwork for generating actionable insights across multiple sectors, such as business, healthcare, and environmental science.
The techniques of data aggregation are varied, spanning from basic summarization, which includes calculating averages, sums, and counts, to more intricate methods that integrate data across distinct dimensions and platforms. Summarization allows for a distilled understanding of datasets by providing key statistics, whereas consolidation is key to piecing together a holistic picture from varied sources, such as multiple databases or sensor outputs [Arrieta et al., 2020].
Aggregation’s importance is highlighted by its role in setting the stage for more detailed analysis. In the healthcare sector, aggregating patient information from different systems can reveal trends in disease spread or treatment efficacy [Arrieta et al., 2020]. For environmental monitoring, combining data from sensors can yield insights into pollution trends or climate patterns, which are instrumental for informed policymaking [Arrieta et al., 2020].
Nonetheless, the aggregation process must be handled with precision to avoid the loss of crucial information or the introduction of bias, which could taint the analysis results [Kuhn & Johnson, 2013]. Meticulous and judicious data aggregation is imperative to ensure the reliability and accuracy of any subsequent analyses.
The aggregation of data is a foundational process that enables the distillation of extensive and complex data into manageable and analyzable forms. It is the precursor to identifying patterns and insights that would remain concealed within the raw data, thereby setting the groundwork for informed decision-making [Patibandla et al., 2021; Arrieta et al., 2020; Kuhn & Johnson, 2013].
Case Study – Using Data Aggregation to Explore the Areas with the Highest Incidence of Burglaries
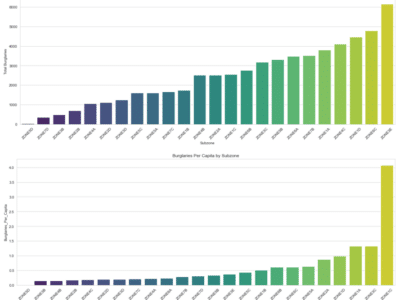
In our project, the application of data aggregation is exemplified in the way we handle the police department calls and census data. By grouping and summing up burglary incidents by subzones, we effectively turn a large, unwieldy dataset into a coherent, structured format that is much more conducive to analysis. This aggregation not only simplifies the data but also brings to light the areas with the highest incidence of burglaries, providing a clear focus for further investigation and predictive modeling.
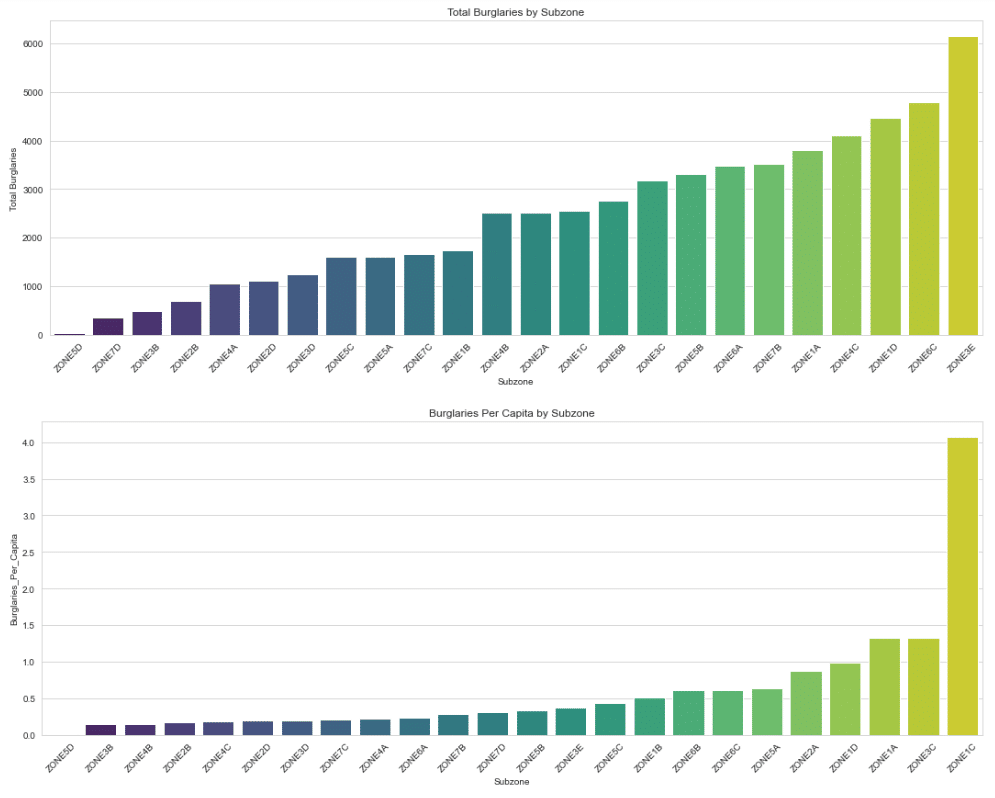
This step is particularly crucial in our predictive analysis, as it sets the foundation for all subsequent modeling efforts. By accurately aggregating the data, we ensure that our predictive models are fed with reliable and relevant information, which is essential for producing accurate forecasts. The aggregation process also helps in identifying patterns and trends that might be obscured in a more scattered dataset, thereby enhancing the effectiveness of our predictive models in suggesting better resource allocation, like police deployment, and in formulating strategic objectives for crime reduction.
Time Series Decomposition: Unraveling Data Over Time
Unpacking the intricacies of time-bound data, time series decomposition emerges as a key analytical process. It dissects a time series into its core elements—trend, seasonality, and residuals—each representing different influences on the data’s progression [Taylor & Letham, 2018]. The trend reflects the long-term trajectory, seasonality indicates the predictable cycles, and residuals cover the random, unexplained fluctuations.
This methodology shines a light on the multifaceted forces shaping data trends. A retailer, for instance, may discern that sales growth is not merely a general rise but interspersed with seasonal spikes, offering a nuanced view of business performance [Taylor & Letham, 2018].
Time series decomposition finds its utility across various domains. Economists can detect growth patterns or downturns, meteorologists can interpret climate tendencies, and financial analysts can assess stock market dynamics. Insights derived from this analysis are foundational for informed, strategic decision-making [Rafferty, 2021].
Tools like Facebook’s Prophet simplify the decomposition process, adeptly handling the datasets’ complexities, such as holidays and other specific events that may sway the data [Taylor & Letham, 2018; Rafferty, 2021].
In essence, decomposing time series data equips analysts with a refined comprehension of temporal patterns, vital for crafting precise forecasts and strategic plans [Taylor & Letham, 2018; Rafferty, 2021].
Case Study – Implementing Time Series Decomposition
In the context of our project, time series decomposition plays a pivotal role in understanding the crime data within each city subzone. By breaking down the number of police calls into trend, seasonality, and residual components, we gain a deeper insight into the underlying patterns of criminal activity. This decomposition allows us to identify whether there is a general upward or downward trend in crime rates over time and to pinpoint specific times of the year when crime peaks or dips, which could be tied to seasonal factors.
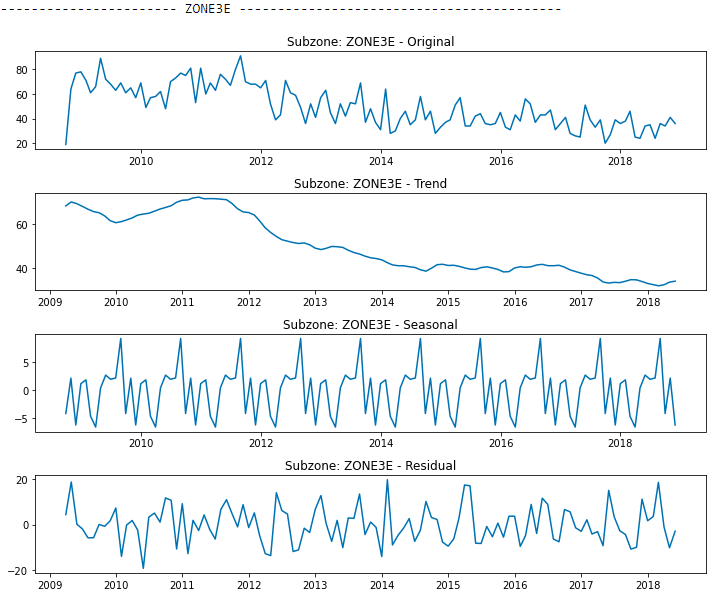
Such detailed analysis is instrumental in forecasting future crime rates and in formulating effective policing strategies. For example, if we observe a consistent increase in certain types of calls during specific months, this information can be used to allocate resources more efficiently and proactively during these periods. Additionally, by separating out the residual component, which represents random fluctuations, we can focus more on the significant elements that actually influence crime trends. This refined understanding aids in developing more accurate predictive models, ensuring that the strategies devised are both responsive and effective in addressing the specific needs of each subzone.
ARMA Models: Understanding Autocorrelation in Time Series
ARMA models serve as a sophisticated means for analyzing and forecasting time series data, effectively leveraging the relationship between current and past observations. The autoregressive (AR) part of the model captures the influence of previous data points, while the moving average (MA) component adjusts for past errors in prediction [Rafferty, 2021]. The concepts of autocorrelation and partial autocorrelation are at the heart of these models, quantifying the degree to which current values in a series are related to their past counterparts with or without the influence of intermediary values.
Ensuring data stationarity is a prerequisite for the application of ARMA models, guaranteeing that the statistical characteristics of the series do not depend on the time at which the data is observed [Rafferty, 2021]. Selecting the appropriate orders for the AR and MA parts, denoted by ARMA(p, q), is a critical step in model fitting. Analysts often rely on correlograms to visually assess autocorrelation and partial autocorrelation, aiding in the determination of the best-fitting model parameters [Rafferty, 2021].
The versatility of ARMA models is illustrated by their use in various sectors. Financial analysts apply them to predict stock market trends, while meteorologists forecast weather patterns using historical data [Rafferty, 2021]. Despite their effectiveness, ARMA models have limitations, particularly when dealing with non-stationary or seasonal data, where ARIMA or SARIMA models may be more suitable [Rafferty, 2021].
In essence, ARMA models are pivotal in extracting meaningful insights from time series data, allowing for robust predictions based on the inherent correlations present in historical data. These models are invaluable in providing a systematic framework for decision-makers to anticipate future events grounded in past data trends [Rafferty, 2021].
Case Study – Utilizing ARMA Modeling Technique
In our project, ARMA models play a significant role in understanding and forecasting the patterns of police calls within city subzones. By utilizing the autoregressive and moving average components, we can analyze how past call volumes influence future volumes, capturing the inherent correlations in the time series data. This is particularly important for identifying short-term trends and patterns in crime, which are crucial for proactive policing and resource allocation.
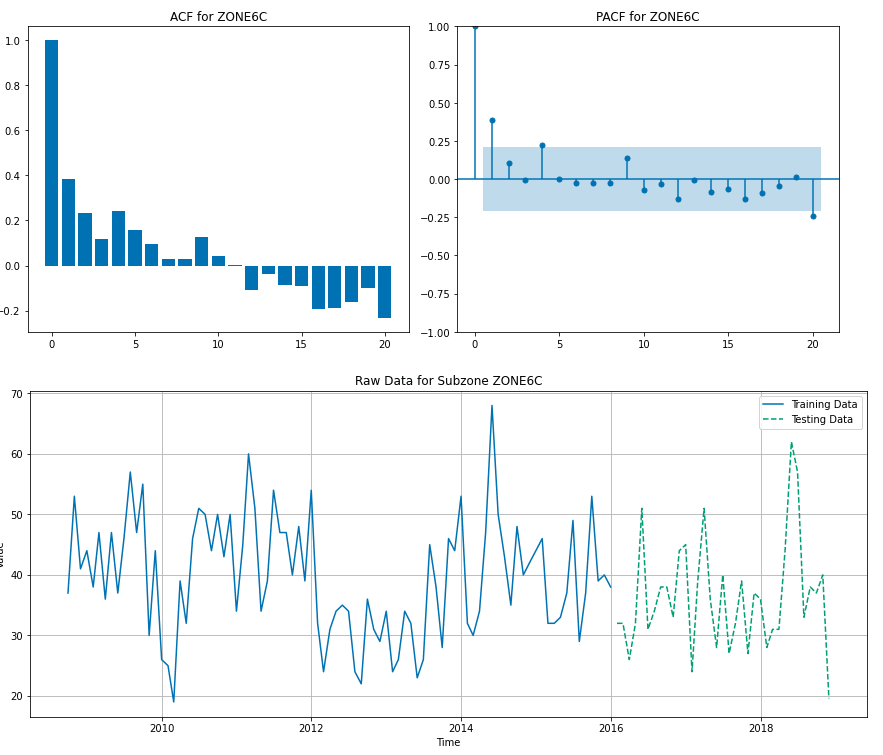
The process of fitting an ARMA model to our data involves carefully selecting the model’s parameters (p and q) based on the degree of autocorrelation and partial autocorrelation observed in the time series. This involves a meticulous examination of the call data to ensure that the chosen model accurately reflects the underlying dynamics. For instance, if we observe a strong correlation between the number of calls in consecutive weeks, this would be factored into the model, allowing us to predict future call volumes with greater accuracy.
However, we are also mindful of the limitations of ARMA models, particularly their assumption of stationarity and the challenges they may face with seasonal data. In cases where our data exhibits clear seasonal trends, we might opt for an ARIMA or SARIMA model instead, which are better equipped to handle such complexities. Overall, the use of ARMA models in our project is a testament to their utility in time series analysis, providing us with valuable insights that help in making informed decisions for better policing strategies.
ARIMA Modeling: Forecasting the Future
The ARIMA model stands as a pivotal tool for analyzing and forecasting time series data. It breaks down the future values in a series by examining correlations with historical data, considering the differences between data points to ensure stationarity, and smoothing over short-term irregularities [Rafferty, 2021]. The model’s parameters, represented as ARIMA(p, d, q), are essential in capturing the essence of the time series, with ‘p’ indicating the autoregressive order, ‘d’ the degree of differencing, and ‘q’ the order of the moving average process [Rafferty, 2021].
Carefully selecting these parameters is imperative for building an effective ARIMA model. Analysts must comprehend the data’s characteristics and employ computational methods to refine the model’s parameters, striving for the optimal balance that encapsulates the series’ behavior [Taylor & Letham, 2018; Rafferty, 2021].
ARIMA’s versatility is evident in its broad application across various sectors, including but not limited to, financial markets, economic forecasting, and weather prediction. For example, in the financial domain, ARIMA models can help predict stock prices, whereas in economics, they may forecast key performance metrics [Rafferty, 2021].
Notwithstanding their robustness, ARIMA models are sometimes challenged by their inherent assumption of linearity and potential struggles with seasonal data. To mitigate this, the SARIMA model extension incorporates seasonal differencing, enhancing the original model’s capability to handle data with seasonal trends [Rafferty, 2021].
ARIMA models are integral to predictive analytics, offering a systematic approach to understanding and forecasting time series data. The careful selection of model parameters is a vital aspect of this process, enabling analysts to harness past and present data dynamics for accurate future predictions [Rafferty, 2021; Taylor & Letham, 2018].
Case Study – ARIMA is our best performing model
In our project, the ARIMA model is employed to forecast future trends in police call volumes in city subzones. By analyzing the historical data of calls, ARIMA helps us understand how past trends and patterns can influence future occurrences. The model’s ability to handle different aspects of the time series – the autoregressive components, the differences to ensure stationarity, and the moving average elements – makes it particularly suited for our analysis where data points are time-dependent and can exhibit trends and seasonalities.
The selection of ARIMA’s parameters (p, d, q) is a critical step in our analysis. This process involves a detailed examination of the data to determine the appropriate level of differencing needed to make the series stationary (d), and the orders of the autoregressive (p) and moving average (q) components. These parameters are fine-tuned to best capture the underlying structure of the police call data, ensuring the model’s forecasts are as accurate and reliable as possible.
Given the intricate nature of crime patterns, which can be influenced by a myriad of factors, the flexibility of the ARIMA model is particularly beneficial. It allows us to construct a model that adapts to the unique characteristics of the data, providing us with forecasts that can inform better policing strategies, resource allocation, and ultimately, contribute to the goal of reducing crime rates in the city’s subzones.
Understanding the Fundamentals of ARDL Models
The Autoregressive Distributed Lag (ARDL) model is an advanced statistical tool that offers significant insights into time series analysis. It distinguishes itself by assessing the dynamic interactions among variables across different time periods. The ARDL framework allows researchers to investigate both the immediate and gradual impacts of one variable on another, revealing intricate patterns that evolve over time.
At its core, the ARDL model integrates a variable’s historical values with those of other predictors to understand their collective influence. It goes beyond traditional autoregressive models by encompassing the lagged values of multiple explanatory variables, thus providing a more comprehensive view of the interdependencies. The resulting equation encapsulates these relationships, expressing the current value of the dependent variable as a function of its own lags, the lags of independent variables, and an error term.
One of the strongest advantages of ARDL models lies in their capacity to distinguish short-term dynamics from long-term trends. This is accomplished by incorporating immediate changes—through differences in variable values—and sustained shifts—via their levels. Consequently, researchers can dissect and appreciate the nuanced effects that unfold over distinct timeframes.
The versatility of ARDL models is evident in their widespread application across various research domains. Economists leverage ARDL to explore connections between income and spending behaviors. Financial analysts utilize it to decode stock market movements. Environmental scientists apply the model to evaluate regulatory impacts on pollution. Public health experts employ ARDL to link healthcare investments to patient outcomes. These diverse applications are testament to the model’s robustness in addressing varied data structures and relational complexities.
ARDL models are invaluable for dissecting the temporal dynamics within time series data. They equip researchers with a robust framework to unravel and quantify variable interplays, enlightening both immediate and extended temporal dimensions.
Case Study – Using ARDL to add neighboring burglarly values as an exogeneous variable
In our project focusing on city subzone crime analysis, the ARDL model is crucial for its ability to assess how various factors interact over time to influence crime rates. For instance, this model allows us to examine not just the immediate effect of an increase in police patrols on crime rates, but also the lagged effects, such as changes in community behavior or criminal tactics over time. By incorporating multiple lagged variables, such as socio-economic indicators or past crime rates, the ARDL model provides a comprehensive understanding of the factors influencing crime dynamics.
This model’s strength lies in its flexibility to handle both short-term and long-term influences. For example, it can capture the immediate impact of a new policing strategy introduced in a subzone, as well as the gradual changes in crime patterns that emerge as a result. The ARDL model’s capacity to distinguish between these immediate and extended effects is particularly valuable for policy planning and evaluation.
Using the ARDL model, we can create more nuanced and effective crime prevention strategies. By understanding the complex interplay of various factors over different time periods, we can tailor our approaches to the unique needs of each subzone, addressing both immediate concerns and long-term trends. This model, therefore, plays a key role in our project, providing insights that are crucial for informed decision-making and effective crime reduction strategies.
The Simplicity of Median Forecasting
In the landscape of predictive analytics, median forecasting stands out for its straightforward approach. It utilizes the median, which is the value at the midpoint of a dataset when sorted, as a predictive measure. This method is lauded for its simplicity and resilience to irregular data points, offering a straightforward alternative to more complex forecasting techniques [Rafferty, 2021].
Implementing median forecasting is a relatively simple process that can be particularly advantageous in situations requiring rapid decision-making. The median provides a central value that is unaffected by extreme outliers, ensuring a more stable predictive measure compared to the mean, which can be significantly skewed by such anomalies [Rafferty, 2021].
This approach is not without drawbacks, as it may not capture the nuances of more volatile datasets where the direction and magnitude of trends are critical. Additionally, in scenarios with highly skewed data distributions, the median may not accurately reflect the dynamics at play, potentially leading to suboptimal forecasting performance [Rafferty, 2021].
Despite these limitations, median forecasting has practical applications across various industries. It serves as an expedient benchmark for gauging the performance of more sophisticated models and can be particularly effective in situations where quick, uncomplicated predictions are valuable, such as setting baselines for sales or inventory levels [Taylor & Letham, 2018; Rafferty, 2021].
To conclude, median forecasting offers a balance between ease of use and predictive capability, making it a useful tool for scenarios where simplicity and speed are paramount. While it may not always be the most precise method, its utility as a benchmark and its robustness to outliers provide a strong case for its inclusion in the forecaster’s toolkit [Taylor & Letham, 2018; Rafferty, 2021].
Case Study – Using a Median Based Model as a Baseline
In our project, median forecasting is primarily utilized as a baseline for comparison with more complex predictive models. Its simplicity offers a quick and straightforward way to establish a basic level of expected police calls in each city subzone. This method, while not highly accurate due to its simplicity and lack of nuance in capturing trends or seasonal variations, serves as an essential benchmark. By comparing the outcomes of sophisticated models against this basic median forecast, we can evaluate the added value and accuracy improvements these complex models provide.
The key role of median forecasting in our analysis is to set a fundamental standard. It offers a rudimentary prediction based solely on the central tendency of historical data, devoid of advanced analytical considerations. This baseline is crucial in demonstrating the effectiveness of more intricate models like ARIMA or ARDL. For instance, if a sophisticated model predicts a significant deviation from the median forecast, it indicates a potential anomaly or trend worth investigating further.
This comparative approach highlights the importance of having a simple, yet functional baseline in predictive analytics. It allows us to quantitatively measure the benefits of employing more advanced statistical methods in our crime data analysis, ensuring that the effort to develop and run these complex models is justified by a tangible improvement over a basic median-based forecast.
Harnessing Facebook Prophet for Accurate Forecasting
Facebook Prophet has emerged as a distinguished forecasting tool, renowned for its straightforwardness and proficiency in managing an array of time series data. Conceived by Sean J. Taylor and Ben Letham from Facebook, Prophet aims to fulfill the demand for a forecasting tool that is both adaptable and intuitive, allowing for a smoother experience even for users with limited forecasting expertise [Taylor & Letham, 2018; Rafferty, 2021].
At the core of Prophet’s approach is an additive model that weaves together trend analysis, seasonal fluctuations, and the impact of holidays to produce nuanced forecasts. The backbone of Prophet is built using the Stan programming language, which delivers swift computational optimizations and provides Bayesian intervals that give a probabilistic measure of forecast uncertainty [Taylor & Letham, 2018; Rafferty, 2021].
The implementation phase for Prophet is user-friendly; the software is open-source and compatible with both Python and R. This flexibility allows users to model time series data with varying frequencies and irregular intervals, ensuring that every forecast is accurately synchronized with the unique patterns observed in the dataset [Rafferty, 2021].
Notably, Prophet’s advanced handling of seasonality is a standout capability. It automatically detects and learns seasonal patterns, and also gives users the liberty to define their own, enhancing the model’s adaptability to specific forecasting scenarios. This feature is particularly beneficial for data with pronounced seasonal behavior or on occasions that significantly influence trends, such as holidays and special events [Rafferty, 2021].
Prophet is designed to be accessible for novices, thanks to its intuitive parameters, while also providing the sophistication required by experts to refine their forecasts. Its application spans various fields, proving useful in predicting retail sales volumes, financial market trends, and even environmental changes [Rafferty, 2021; Taylor & Letham, 2018].
In conclusion, Facebook Prophet represents a compelling choice for forecasters from all walks of professional life, blending simplicity with precision. Its adeptness at addressing complex seasonal patterns, accounting for holidays, and adapting to the granularity of data cements its position as a go-to forecasting solution in our increasingly data-centric era [Taylor & Letham, 2018; Rafferty, 2021].
A Future Step in our Case Study
Incorporating Facebook Prophet into our project could have provided an additional layer of sophistication in our forecasting efforts. Prophet’s adaptability and intuitive nature make it a strong candidate for analyzing time series data, especially in scenarios where data exhibits non-linear trends and strong seasonal effects.
One key advantage of Prophet is its ability to handle complex seasonality patterns, which could be particularly relevant in crime data analysis. Crime rates often vary with seasonal changes, holidays, and other events. Prophet’s capability to model these fluctuations automatically and its flexibility to incorporate custom seasonality and holiday effects could have offered more refined predictions compared to traditional models.
Moreover, Prophet’s Bayesian approach to uncertainty estimation is another feature that could have enhanced our project. This approach provides probabilistic forecasts, offering a range of possible outcomes with associated probabilities. Such an approach could have been valuable in understanding the uncertainty and risks involved in crime forecasting, enabling a more nuanced resource allocation and strategic planning.
Comparatively, while models like ARIMA and ARDL are powerful, they often require extensive data pre-processing and parameter tuning, which can be complex and time-consuming. Prophet, on the other hand, is designed to be more user-friendly, requiring less intricate setup, which could have expedited our analysis process. Additionally, its ability to handle irregular time series data seamlessly could have been advantageous, given the potential irregularities in crime reporting.
In summary, experimenting with Facebook Prophet could have offered us an alternative perspective, balancing ease of use with sophisticated analytical capabilities. Its unique features, particularly in handling seasonality and providing uncertainty estimates, could have complemented the traditional models used, potentially leading to a more comprehensive and robust forecasting framework in our crime data analysis.
Case Study Conclusion
Our exploration of predictive models in urban crime analysis revealed key insights. While a basic naive model using median values surprisingly held up well against more complex models, the effectiveness of each model varied by subzone. The ARIMA model excelled in subzone 3E, outperforming others in accuracy. In contrast, the ARMA model faced challenges in this subzone, likely due to data non-stationarity.
Interestingly, the ARDL model did not show significant improvement over the simpler AR model for zones 6C and 1D, indicating that its additional complexity didn’t capture extra influential factors. For zone 1D, the AR model was marginally better, while for zone 6C, the ARMA model proved most effective.
This project highlights the importance of model selection based on specific data characteristics and the context of each subzone, demonstrating that more complex models are not always the most effective. If I were to continue this project, I would explore the results from a fine-tuned Facebook Prophet model for additional comparison.
References:
Arrieta, A. B., Díaz-Rodríguez, N., Del Ser, J., Bennetot, A., Tabik, S., Barbado, A., … & Herrera, F. (2020). Explainable Artificial Intelligence (XAI): Concepts, taxonomies, opportunities and challenges toward responsible AI. Information fusion, 58, 82-115.
Kuhn, M., & Johnson, K. (2013). Applied predictive modeling (Vol. 26, p. 13). New York: Springer.
Patibandla, R. L., Srinivas, V. S., Mohanty, S. N., & Pattanaik, C. R. (2021, September). Automatic machine learning: An exploratory review. In 2021 9th International Conference on Reliability, Infocom Technologies and Optimization (Trends and Future Directions)(ICRITO) (pp. 1-9). IEEE.
Rafferty, G. (2021). Forecasting Time Series Data with Facebook Prophet: Build, improve, and optimize time series forecasting models using the advanced forecasting tool. Packt Publishing Ltd.
Taylor, S. J., & Letham, B. (2018). Forecasting at scale. The American Statistician, 72(1), 37-45.
 Exploring Regression Models on a Time Series Project